After learning the basics of common candlestick patterns, this third lesson in the Futures Investment with AscendEX LingDong Academy will introduce you to the candlestick indicator of moving averages, and teach you how to use moving average indicators for market analysis.
I. Concept of Moving Averages
The moving average, abbreviated as MA, is one of the most common and widely used technical indicators.
MA uses statistical analysis to calculate the average price of a cryptocurrency over a certain period and connects these average values over fixed periods to form a continuous price line. This is used to observe the overall trend of cryptocurrency prices.
II. Types of Moving Averages
There are many types of moving averages, but generally, they can be classified into short-term MA, medium-term MA, and long-term MA based on a time frame.
Common short-term moving averages include: MA5 and MA10; medium-term moving averages include: MA30 and MA60; long-term moving averages include: MA90, MA120, and MA240. Investors can choose the moving average that suits their trading habits, style, and preferences for analysis and judgment.
III. Application of Moving Averages
The application of moving averages in technical analysis mainly includes three aspects: support and resistance, crossover, and the Gartley pattern.
1.Support and Resistance of Moving Averages
The term "support and resistance" of moving averages refers to the support of moving averages in an uptrend and the resistance in a downtrend.
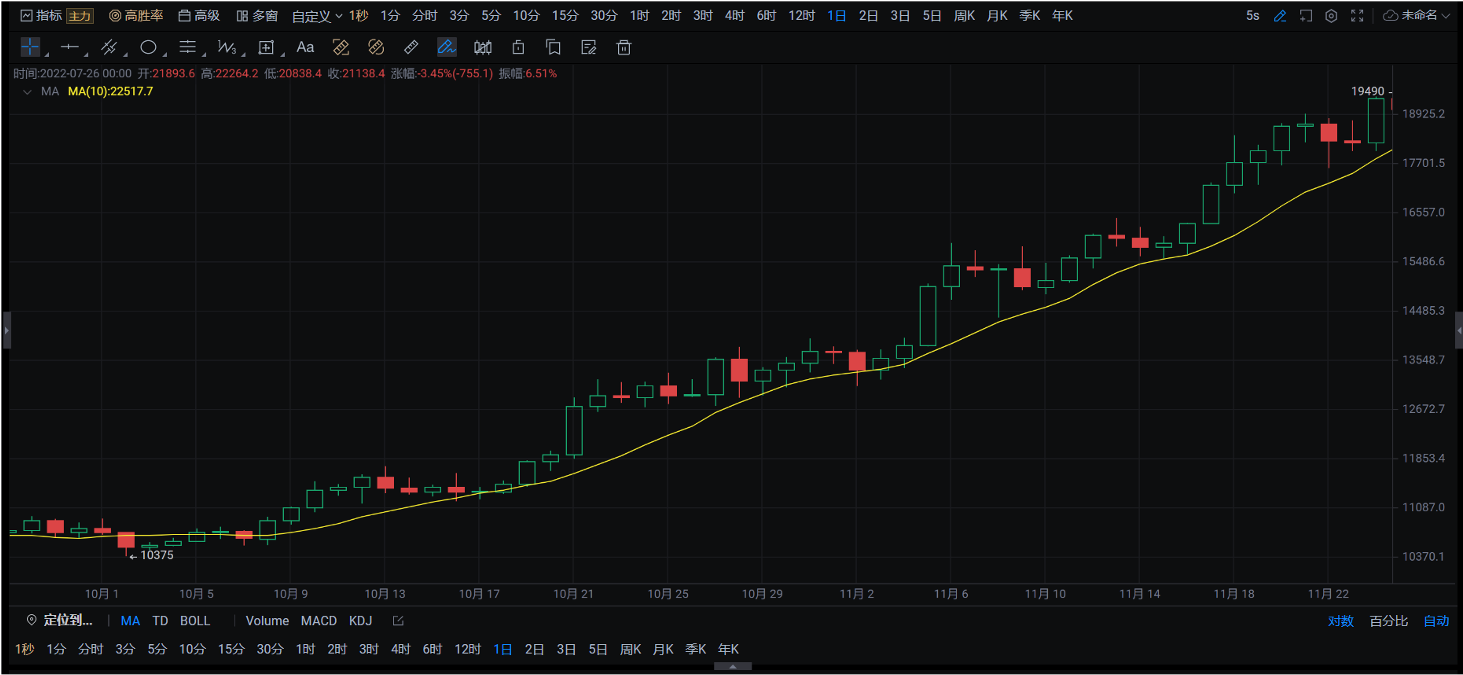
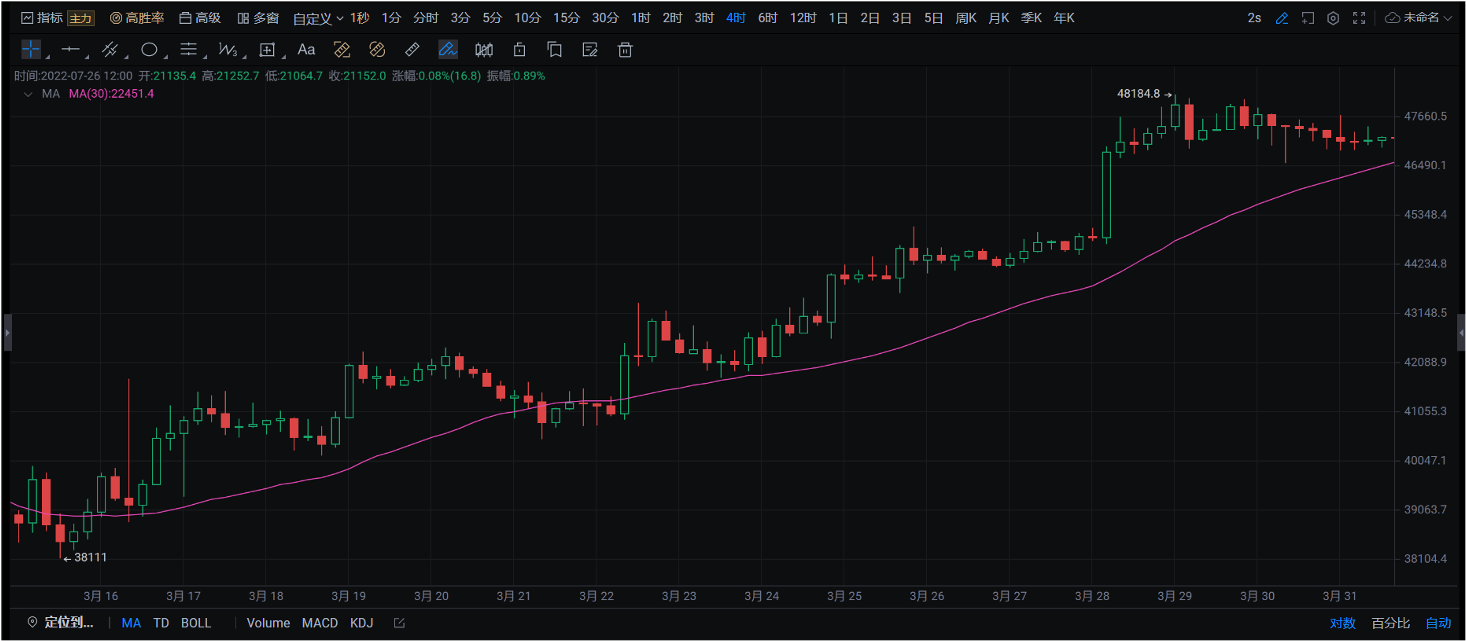
(1) MA Support
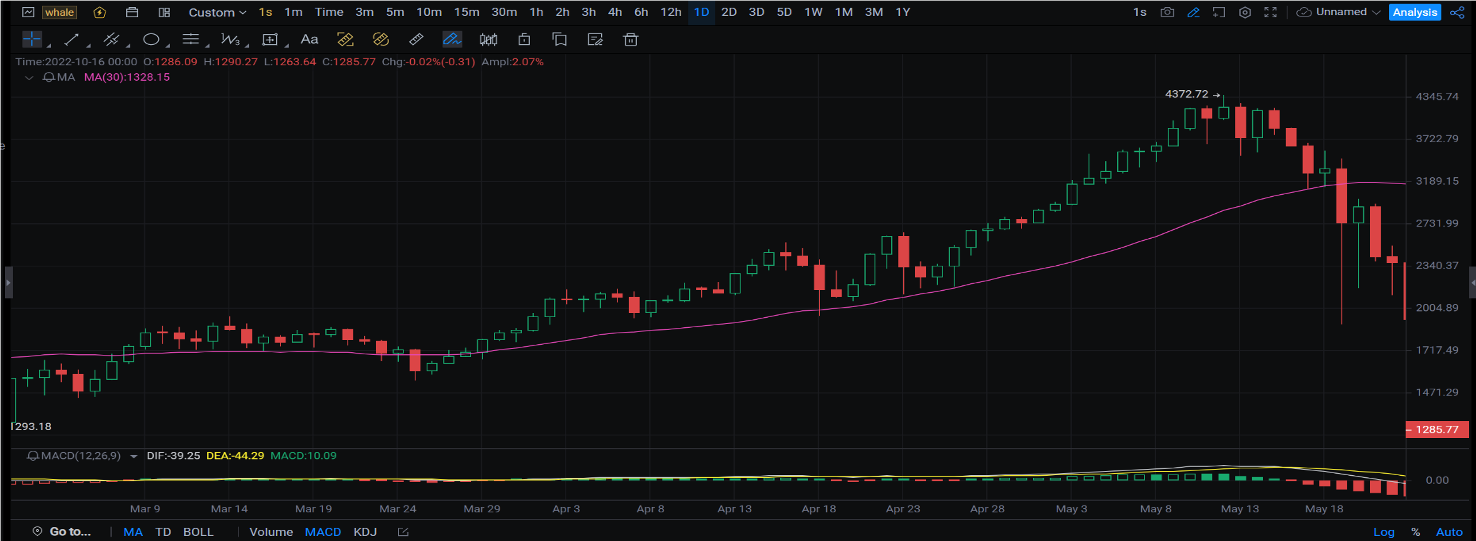
In an uptrend, when the asset price rises by a certain level, a pullback to near the moving average creates a new upward wave. This position is called the moving average support.
The support of moving averages mainly occurs in uptrends, with medium to long-term moving averages as the standard.
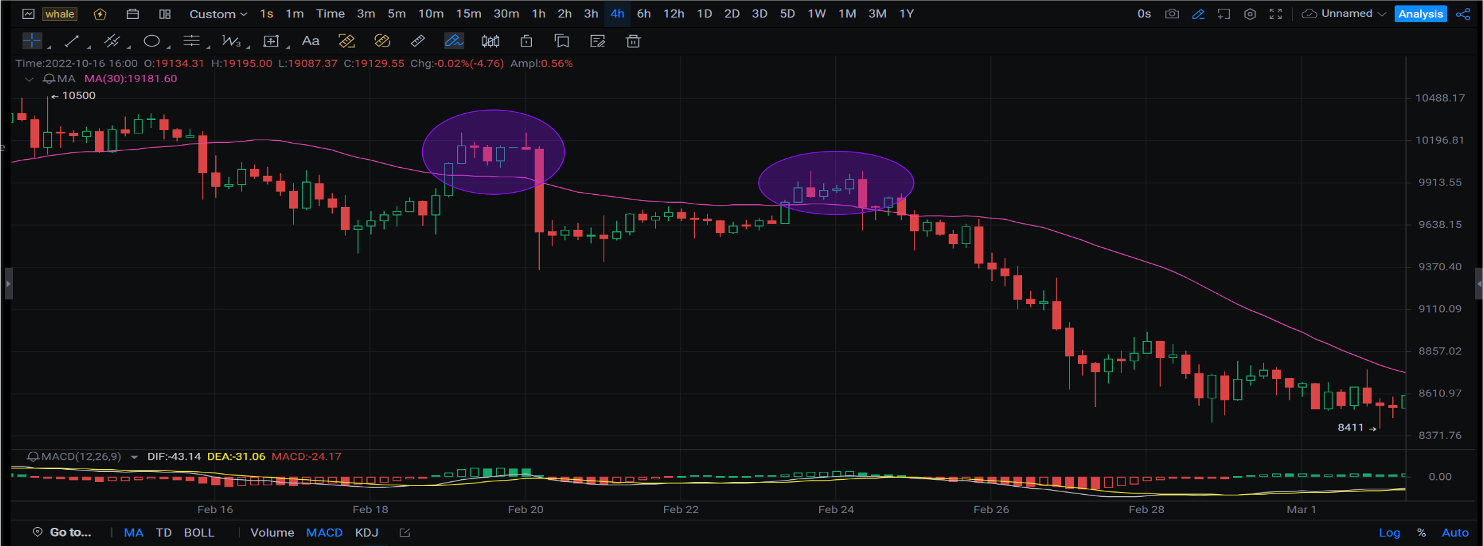
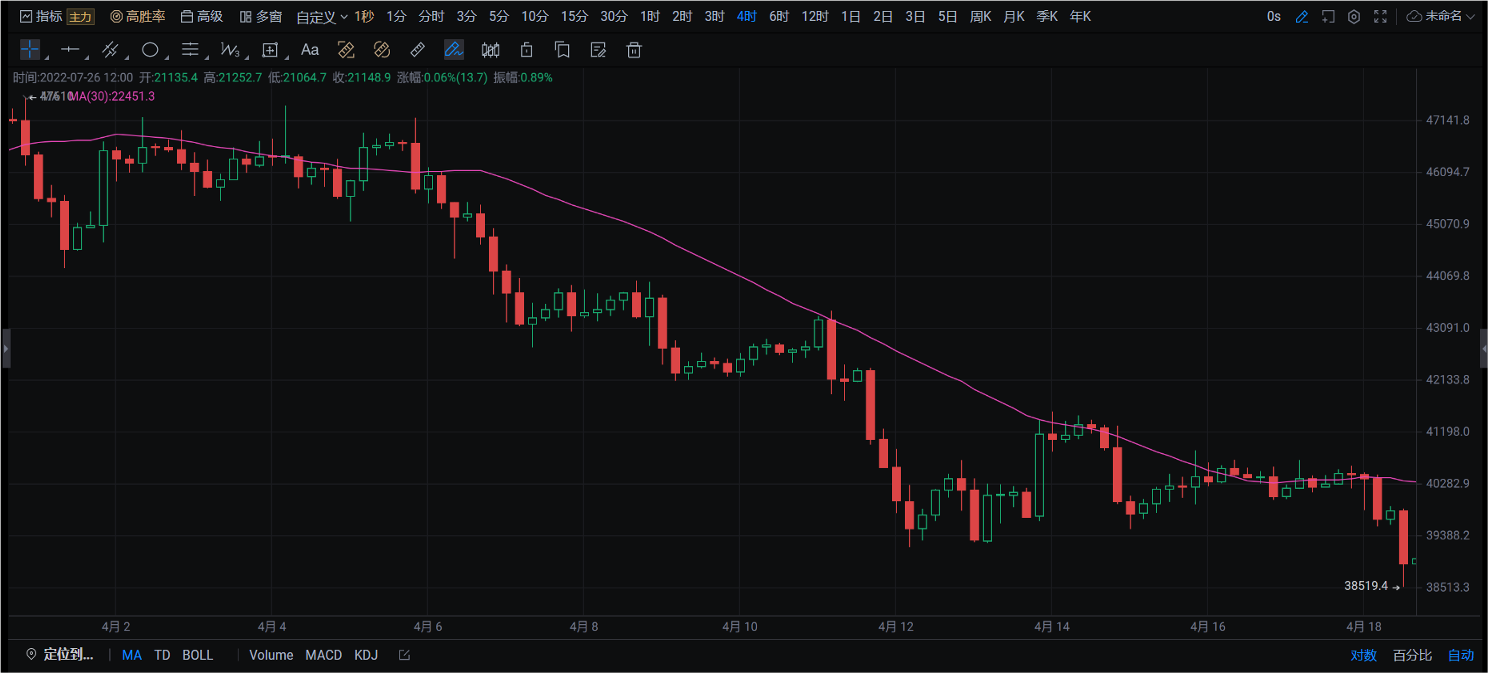
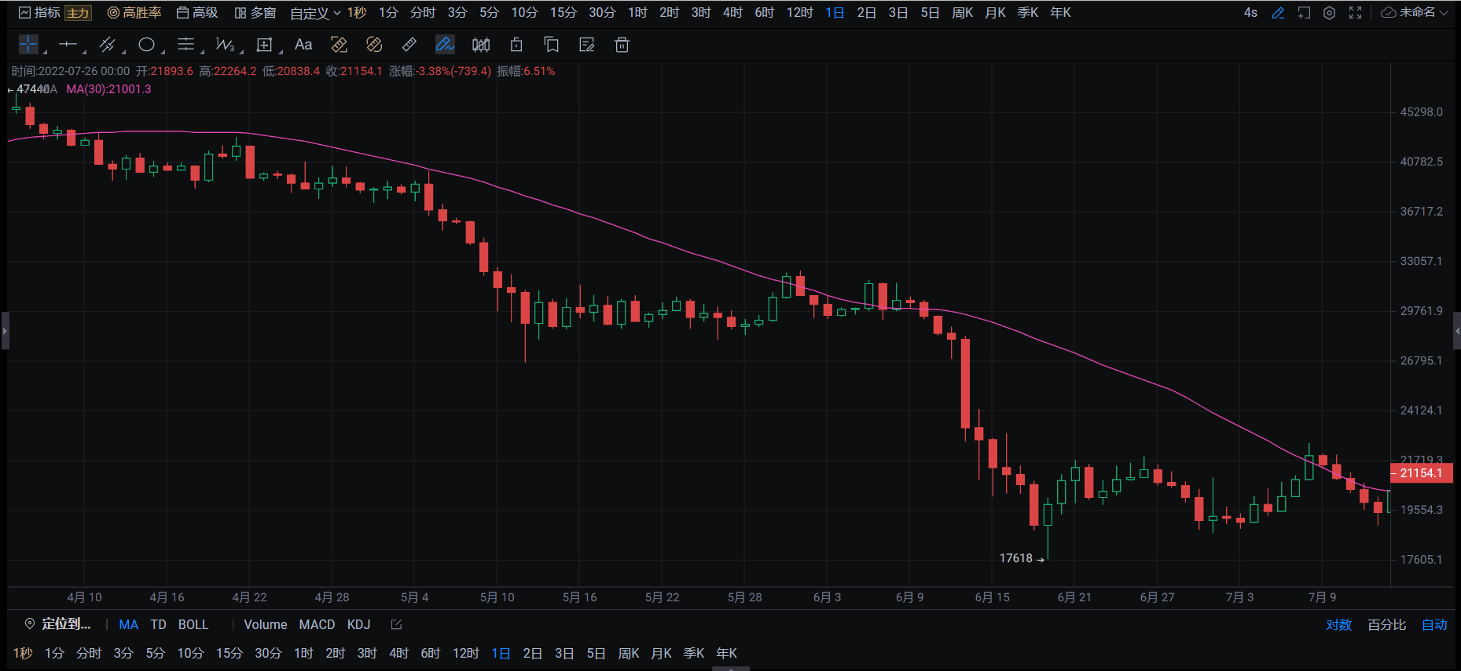
(2) MA Resistance
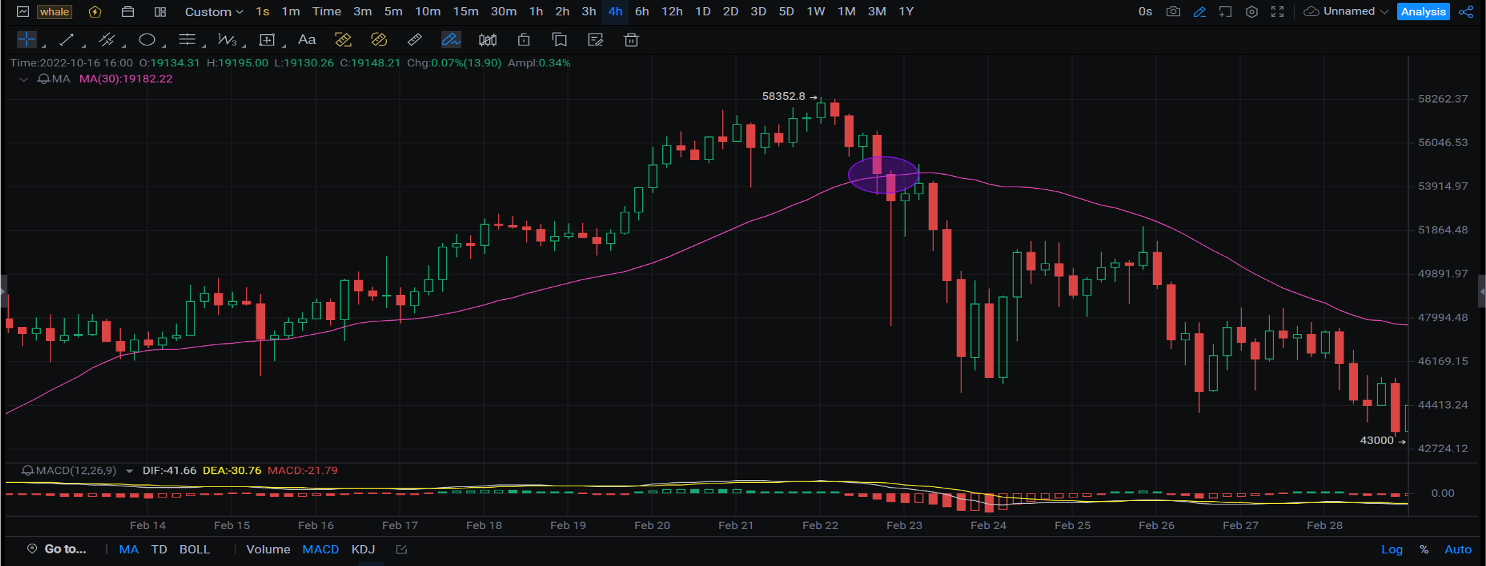
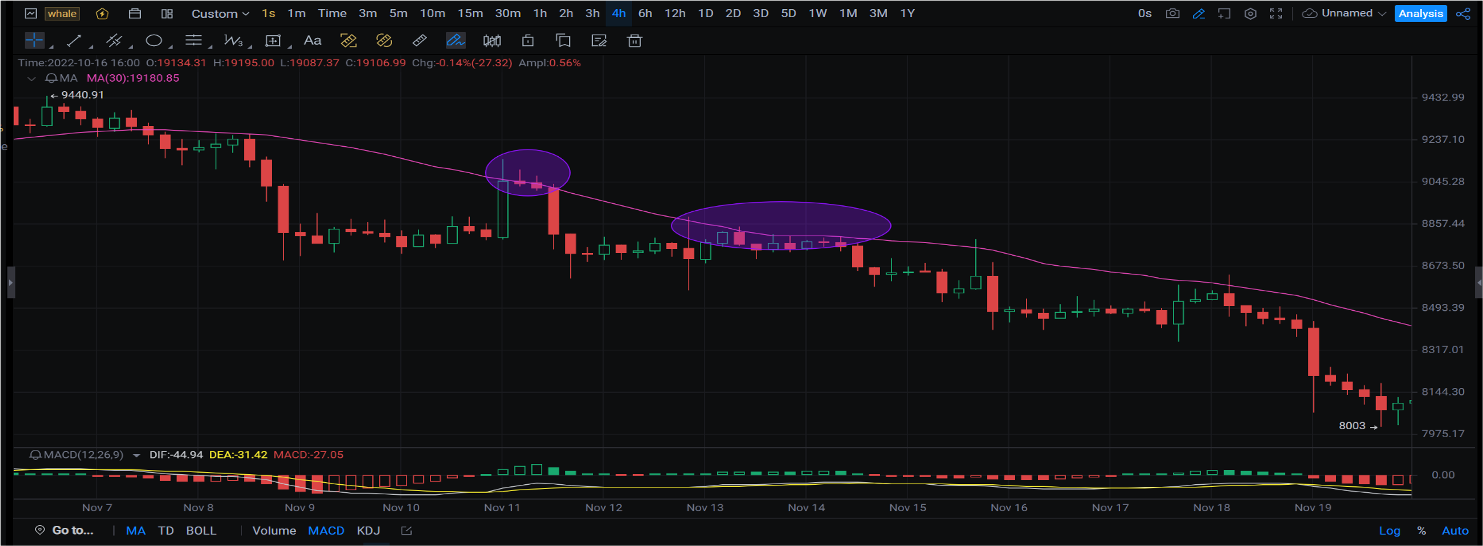
In a downtrend, when the asset price falls by a certain level, a rebound to near the moving average creates a new downward wave. This position is called the moving average resistance.
The resistance of moving averages mainly occurs in downtrends, with medium to long-term moving averages as the standard.
2. Moving Average Strategy
(1) MA Crossover
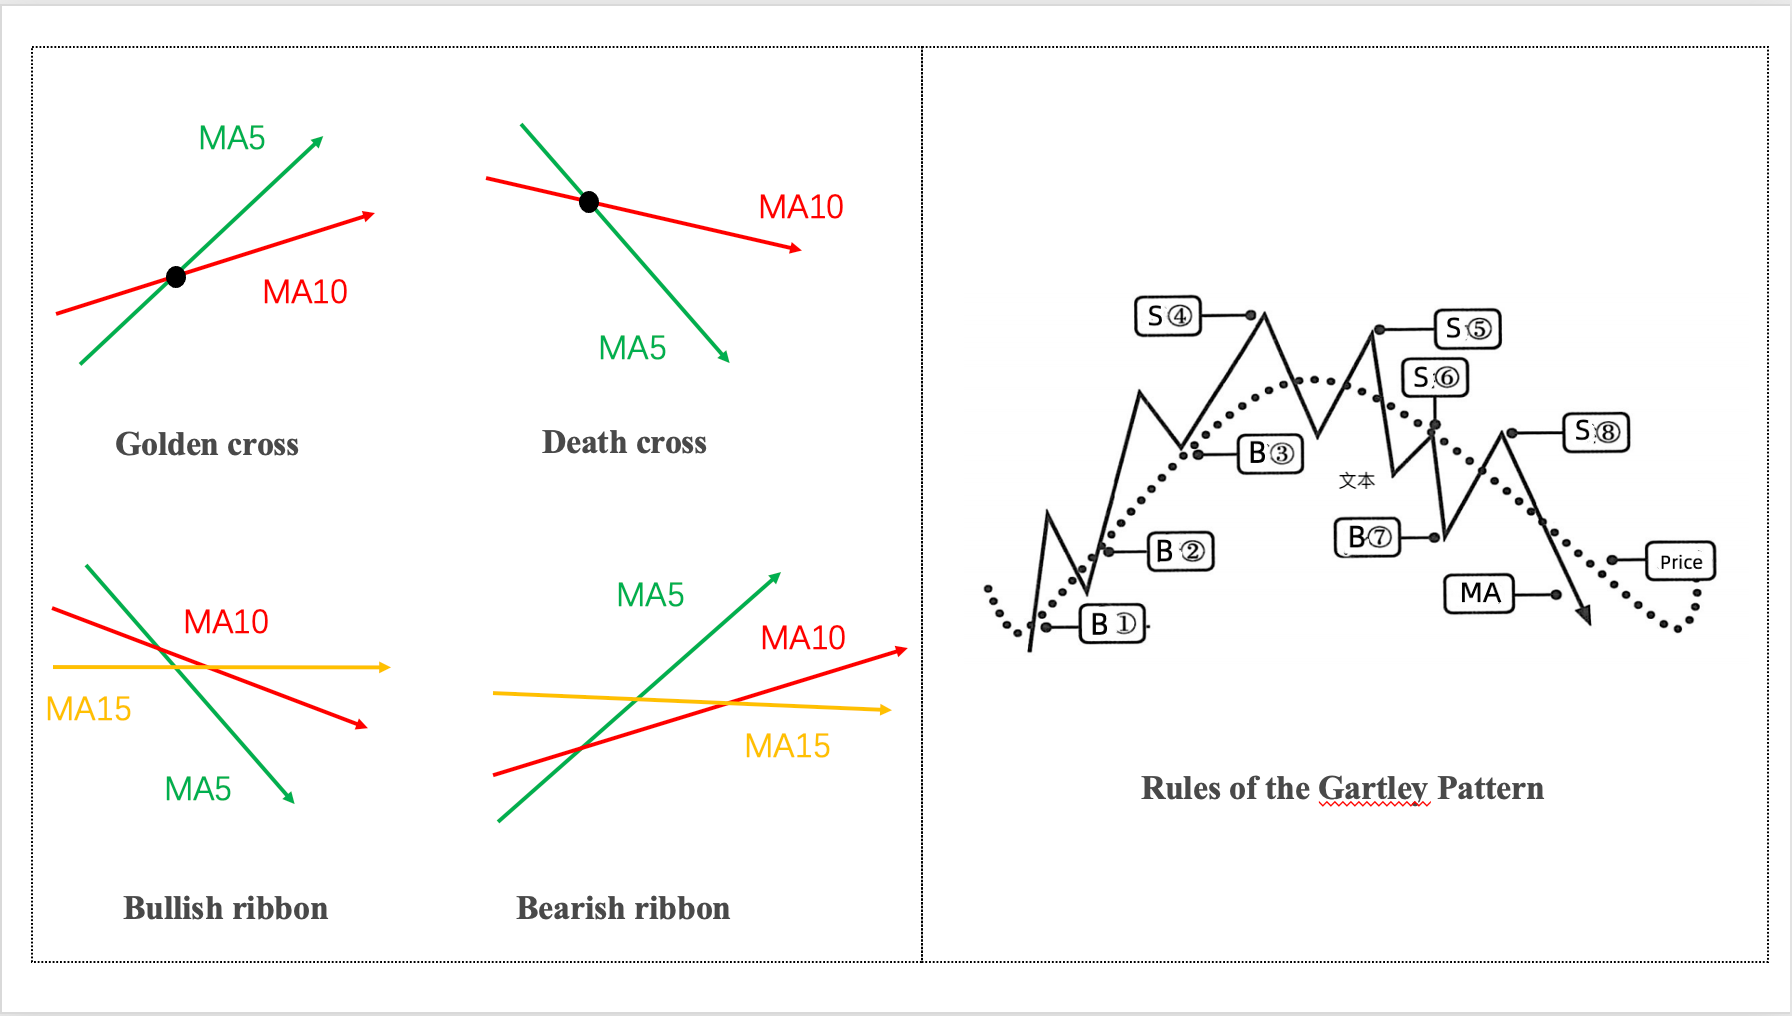
- When a short-term moving average crosses above a long-term moving average, it's called a "golden cross," which is a buy signal.
- When a short-term moving average crosses below a long-term moving average, it's called a "death cross," which is a sell signal.
Golden cross – buy signal
When the 5-day short-term moving average crosses above the 10-day long-term moving average at a low point, it's called a "golden cross." The golden cross is typically considered a favorable buy signal.
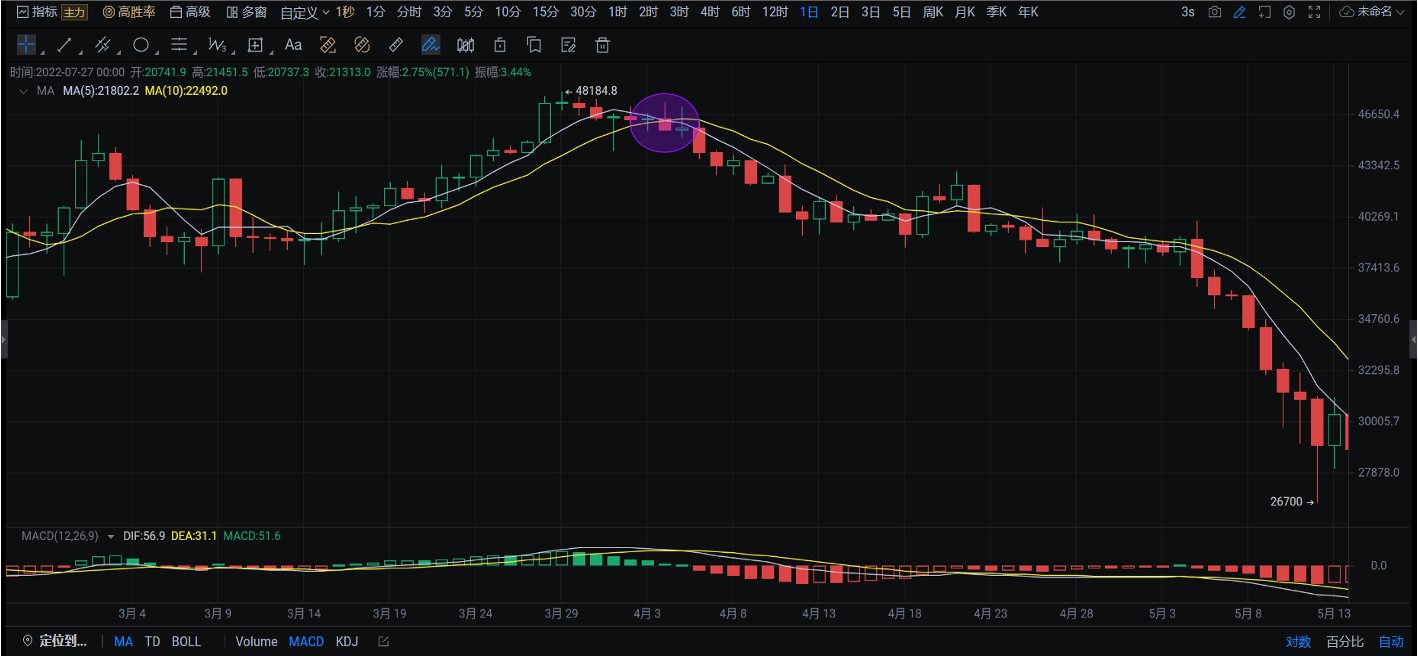
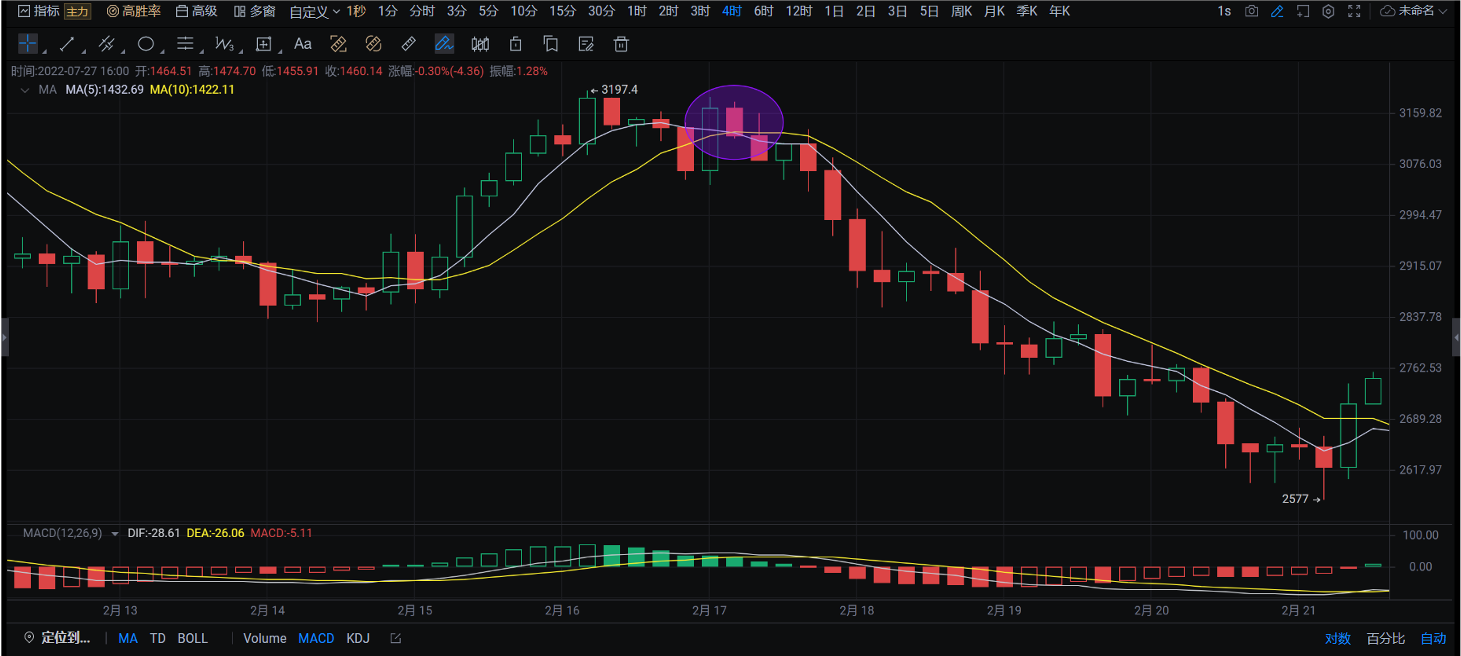
Death cross – sell signal
When the 5-day short-term moving average crosses below the 10-day long-term moving average at a high point, it's referred to as a "death cross." A death cross is typically considered a favorable sell signal.
(2) MA Ribbon
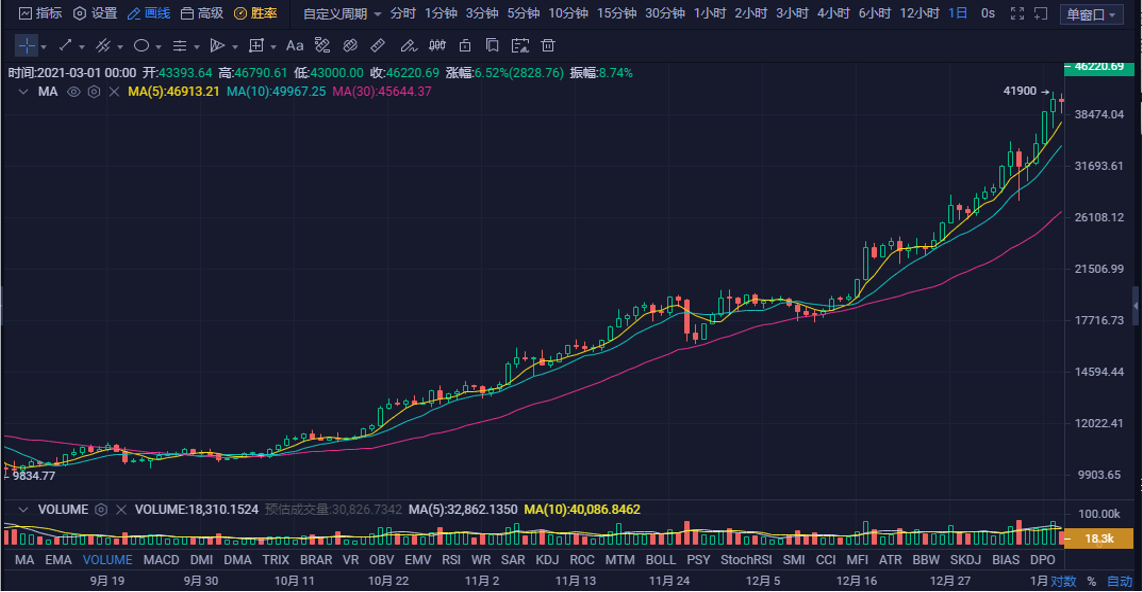
Bullish ribbon
①When prices are rising, the candlesticks are positioned above the moving averages.
②And all moving averages are aligned naturally from the smaller timeframes to the larger ones.
A bullish ribbon indicates:
• It's an optimal period for investors to hold long positions, as prices show a strong upward trend.
• Bullish ribbons often occur when positive news is prevalent, and bullish forces prevail, causing prices to rise steadily.
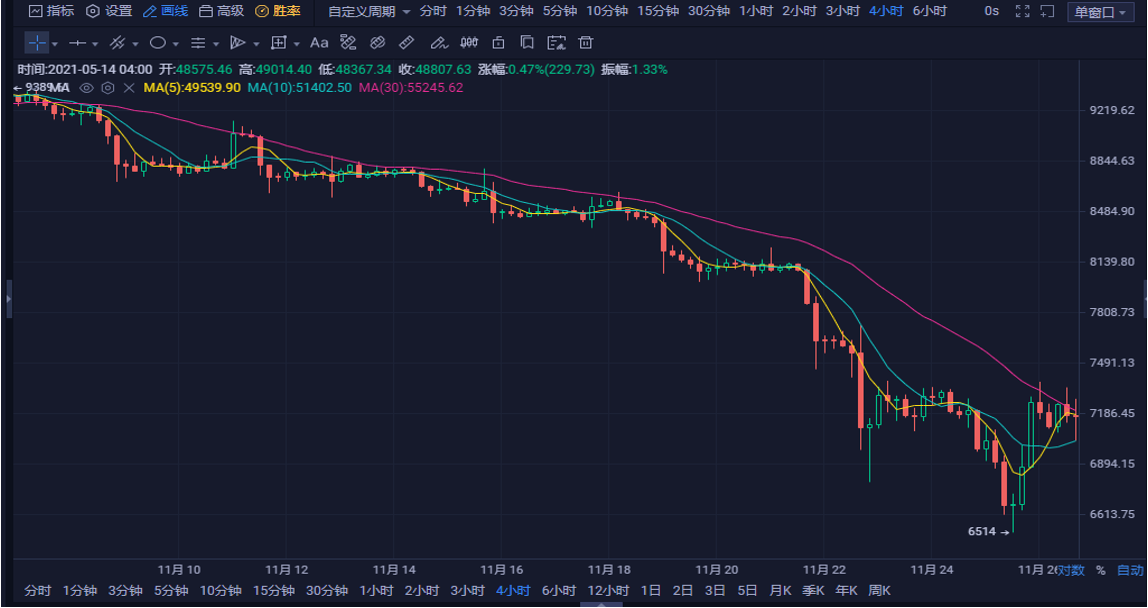
Bearish ribbon
①When prices are falling, the candlesticks are positioned below the moving averages.
②And all moving averages are arranged naturally from the smaller timeframes to the larger ones.
A bearish ribbon shows:
• It's an optimal period for investors to hold short positions, as prices show a strong downward trend.
• Bearish ribbons often occur when negative news is prevalent, and bearish forces prevail, causing prices to drop steadily.
3.Rules of the Gartley Pattern
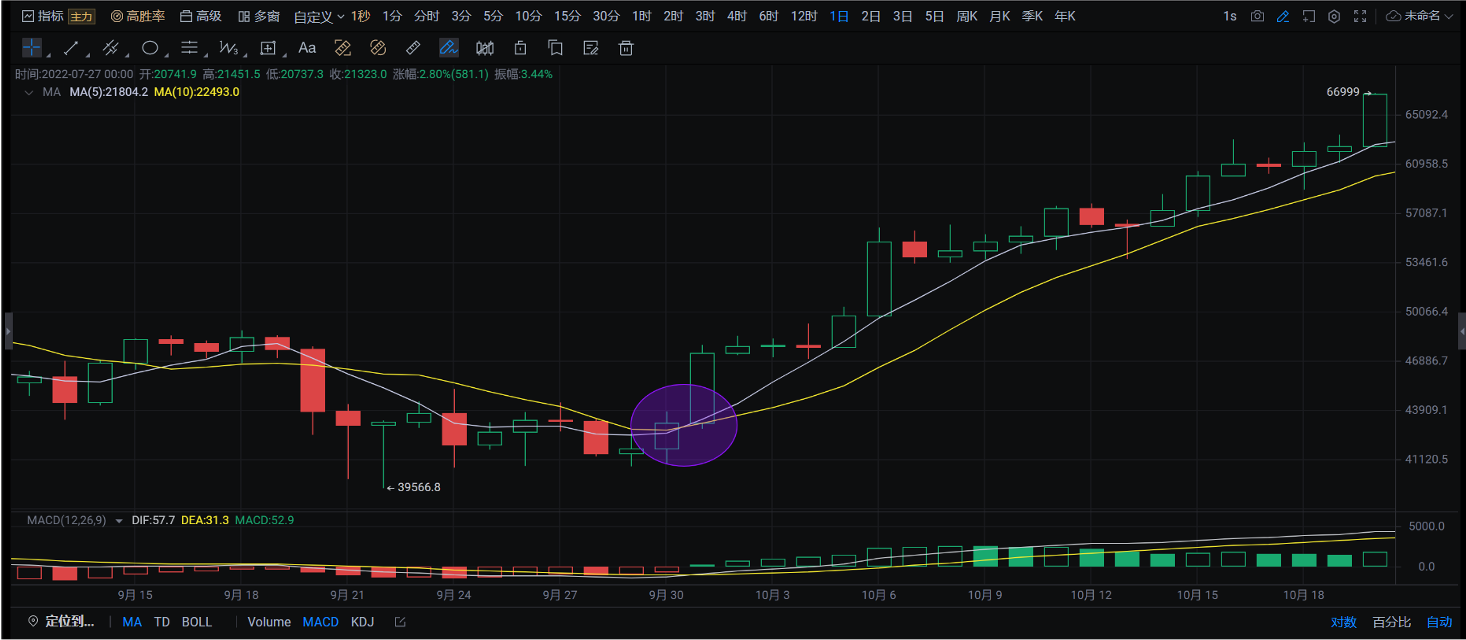
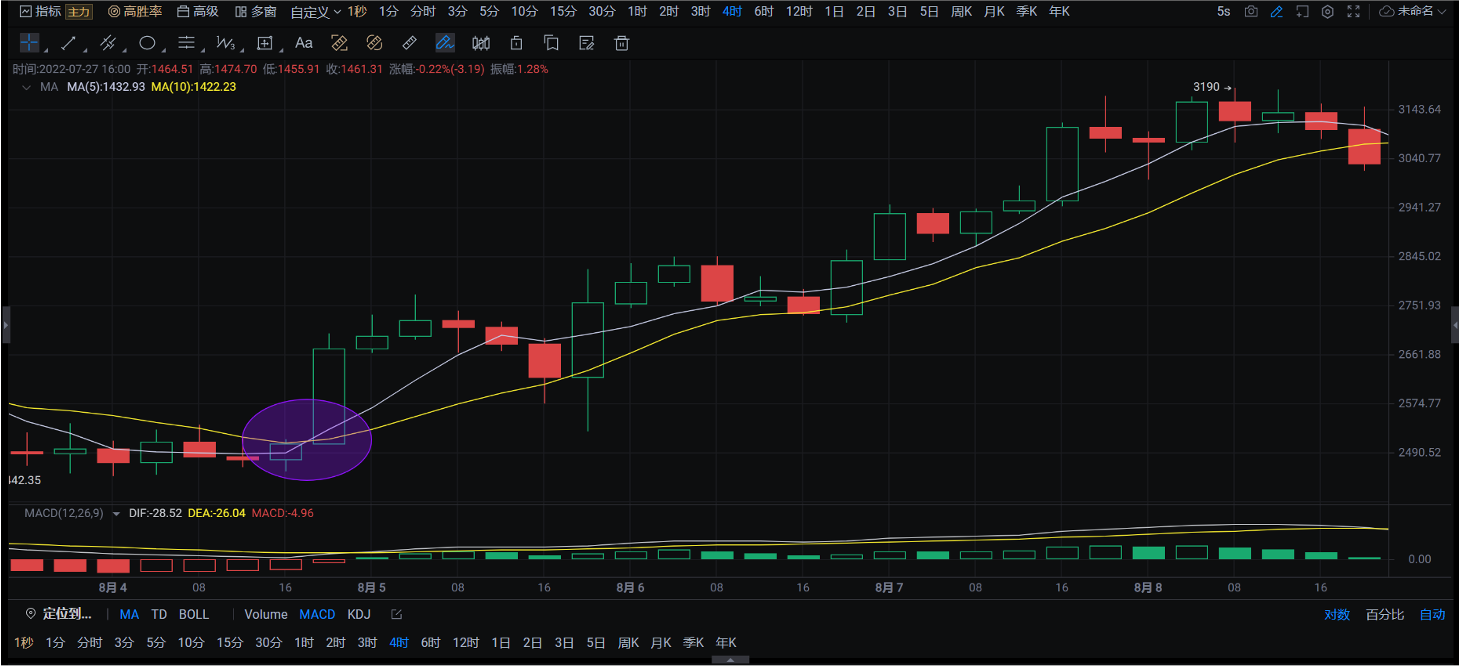
1. When the moving average gradually flattens and slightly tilts upwards after a downtrend, and the price breaks above the moving average, it generates a buy signal.
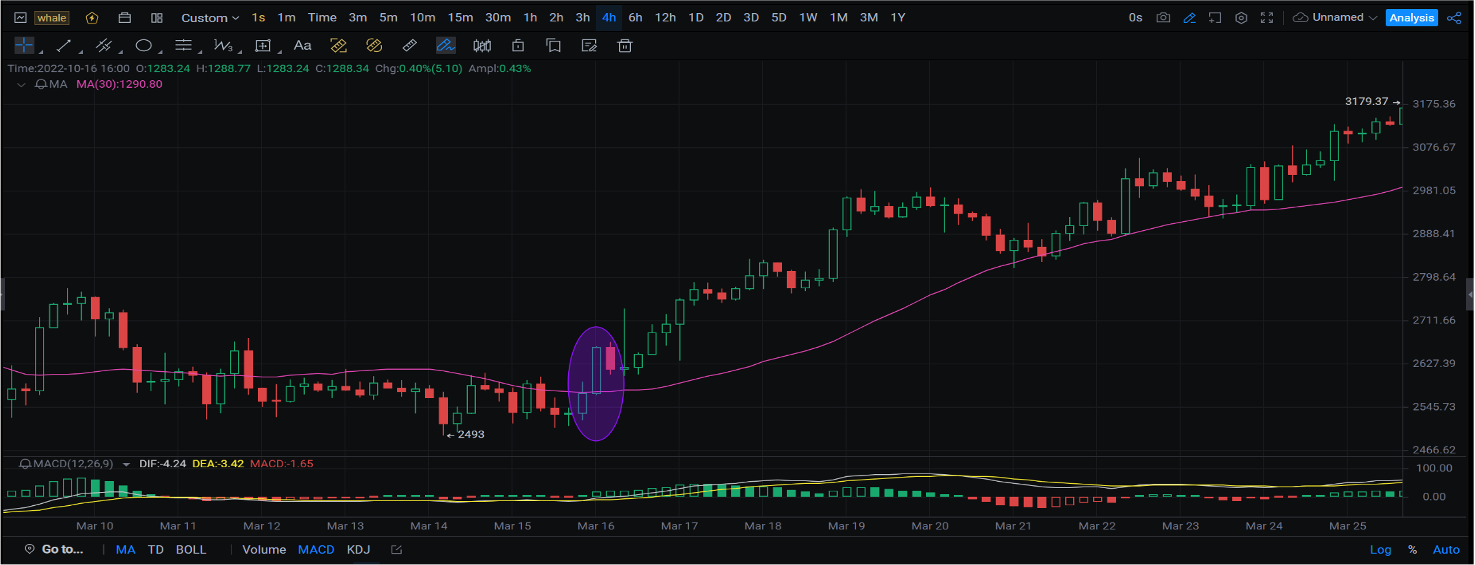
2. When the price is trading above the moving average and experiences a retracement without falling below the moving average, followed by another upward movement, it presents a buying opportunity.
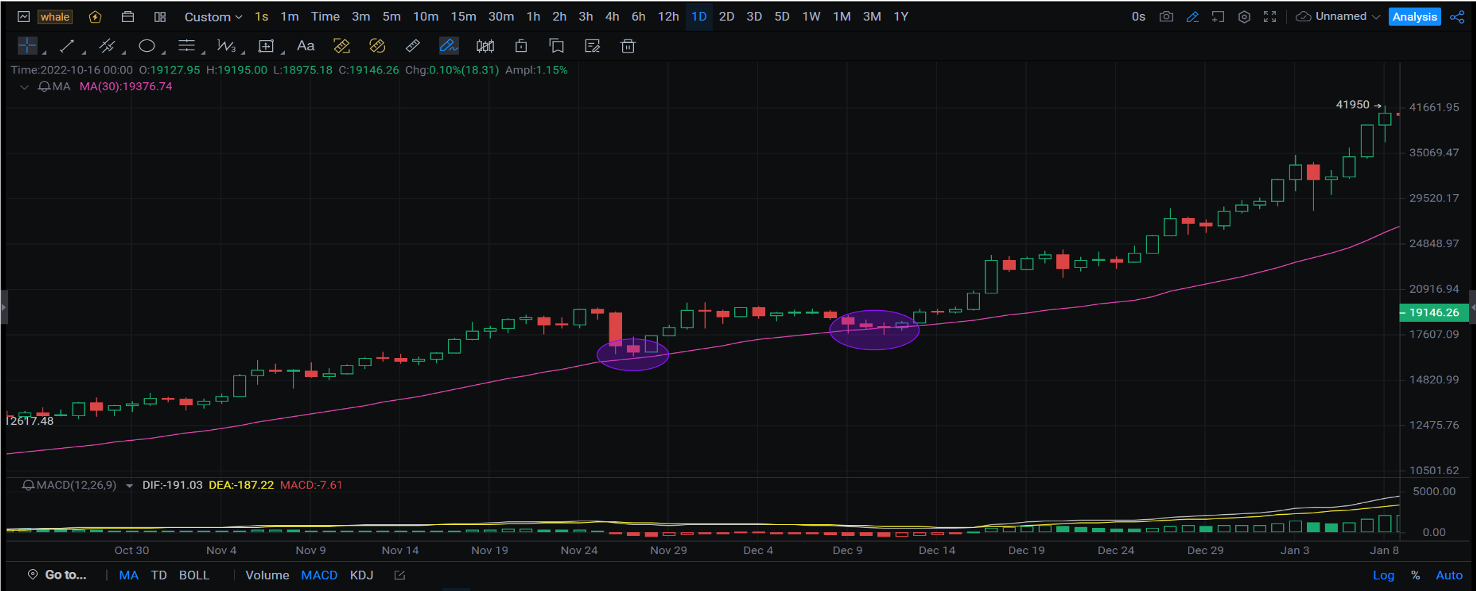
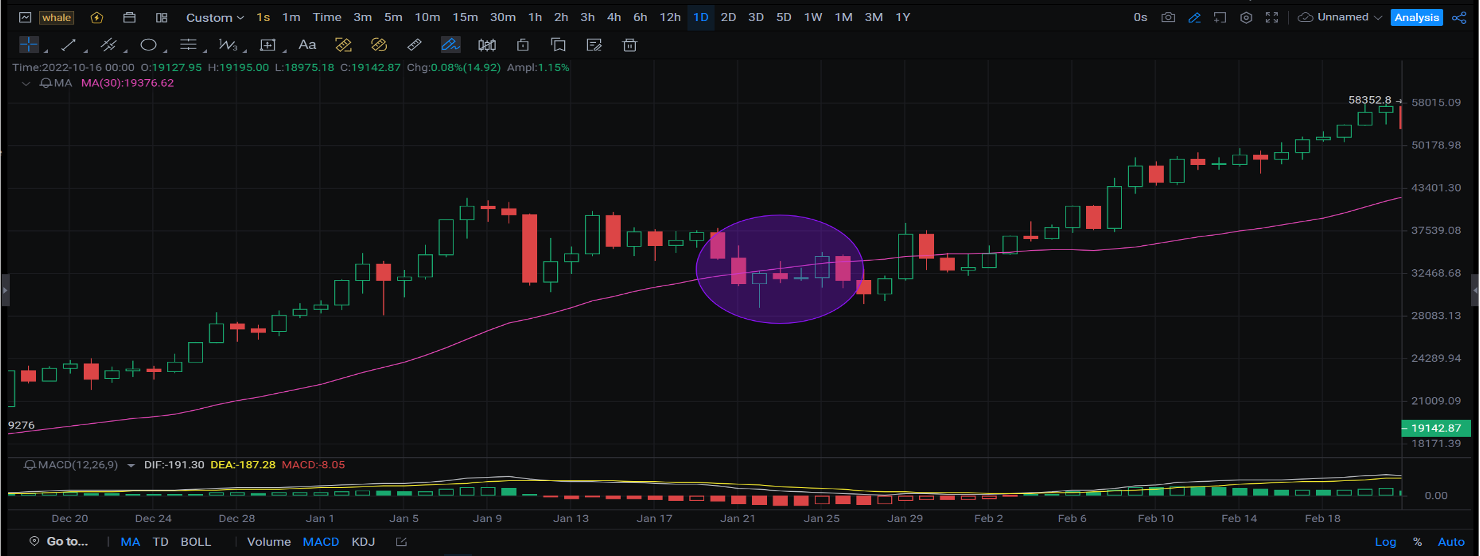
3. When the price is trading above the moving average and experiences a retracement and falls below the moving average while a long-term MA keeps an upward trend, it presents a buying opportunity.
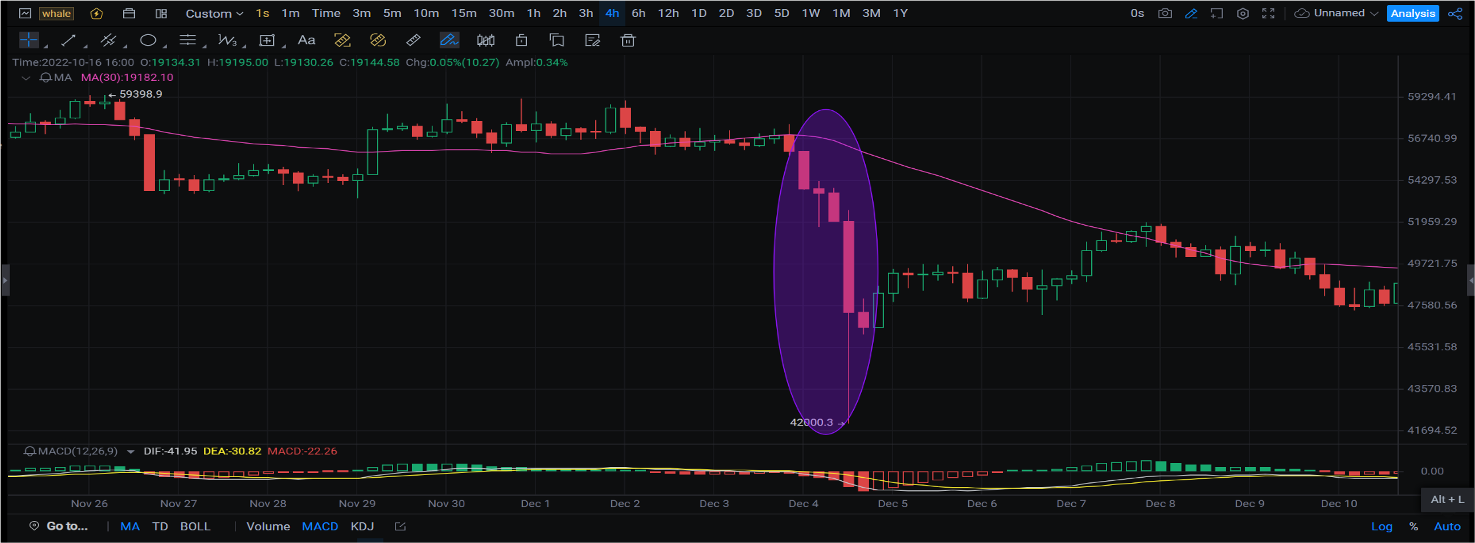
4. When the price is trading below the moving average and experiences a sudden sharp decline, getting significantly far away from the moving average, it's highly likely to rebound towards the moving average. It's a good buying opportunity.
5. When the price is trading above the moving average and experiences several consecutive days of significant gains, moving further away from the moving average, it indicates that recent buyers have made substantial profits and may soon start selling to take profits. This is a temporary sell signal.
6. When the moving average, which was previously rising, starts to flatten out, and the price falls below it, it suggests increasing selling pressure. This is a selling signal.
7. When the price is trading below the moving average and experiences a rebound but fails to break above the moving average, and the moving average's downtrend starts to slow down and becomes more horizontal before another downward trend, it's a selling opportunity.
8. When the price rebounds but hovers around the moving average, while the moving average continues to decline, it's advisable to sell.