Welcome to the fourth lesson of the "AscendEX LingDong Academy on Futures Investment," where we will dive into the Bollinger Bands indicator and learn how to use it for market analysis.
I. Concept of Bollinger Bands
The Bollinger Bands, also known as BOLL, is a technical analysis indicator named after John Bollinger, a renowned American writer and financial analyst who created it. This tool calculates a price envelope based on standard deviations and characterize price volatility and future trends, being plotted as a band with the upper and lower prices.
II. Components of Bollinger Bands
Bollinger Bands consist of three price curves: the upper band, middle band, and lower band. The area between the upper and lower bands forms the value channel of the Bollinger Bands indicator, with the middle band serving as the central axis for price fluctuations.
III. Characteristics of Bollinger Bands
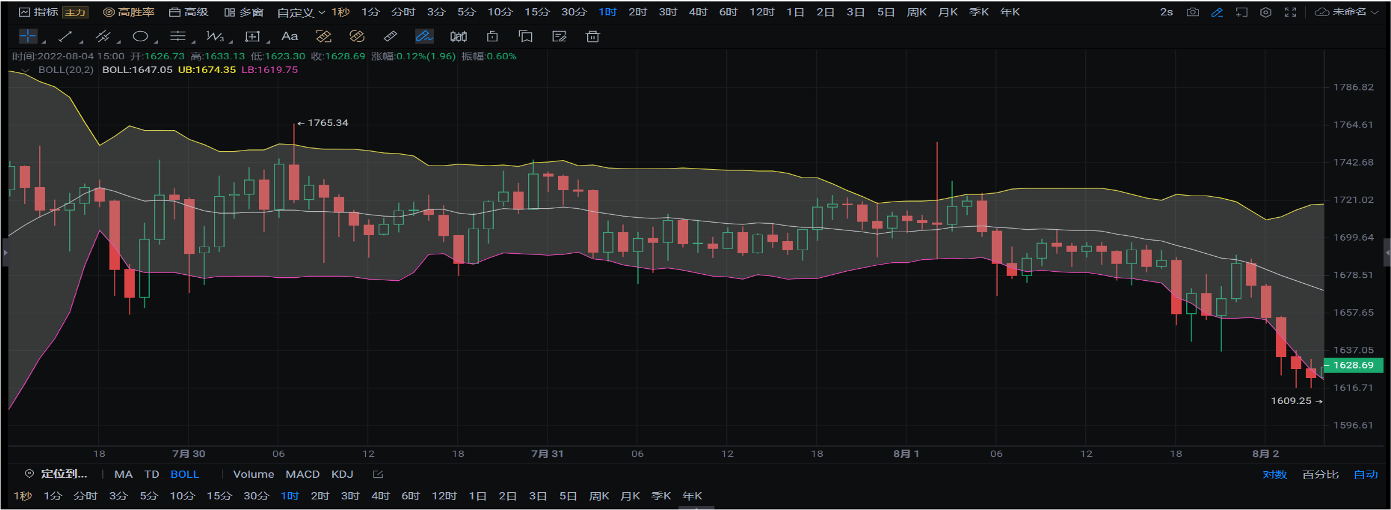
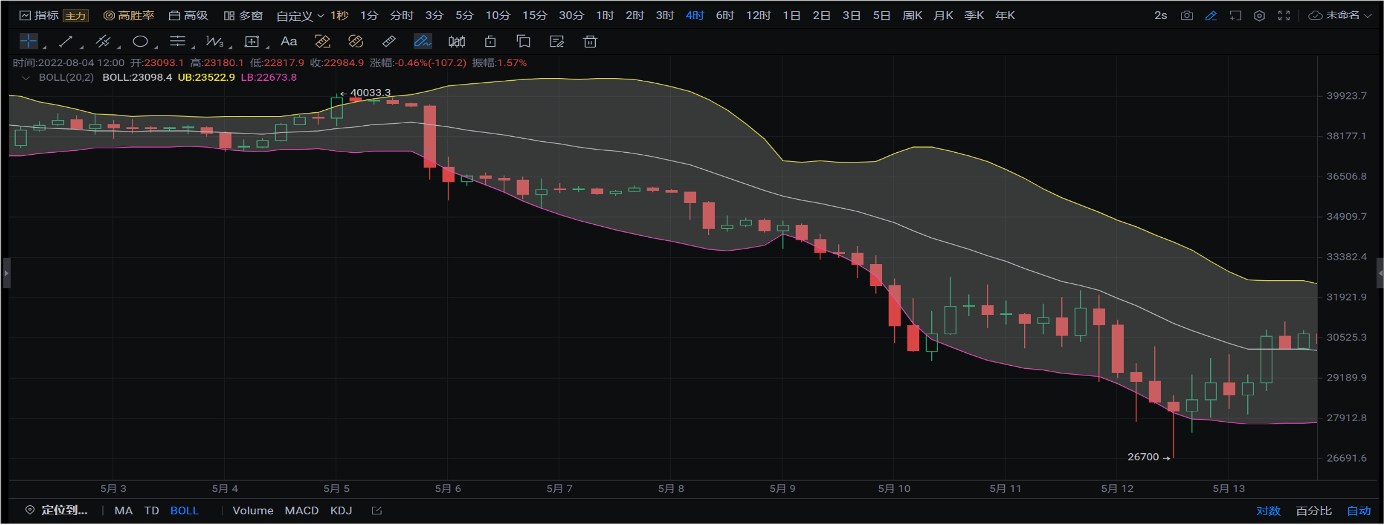
1. Bollinger Bands are a path indicator, meaning that the width of bands between the upper and lower bounds varies with price volatility. When the price experiences larger movements, the width of the Bollinger Bands expands accordingly. Conversely, when the price experiences smaller fluctuations or enters a consolidation phase, the width of the channel narrows.
2. The upper and lower bands of the Bollinger Bands display the highest and lowest price levels where the price can safely operate. The lower band provides support for the price, while the upper band acts as resistance. The middle band can sometimes function as support and at other times as resistance.
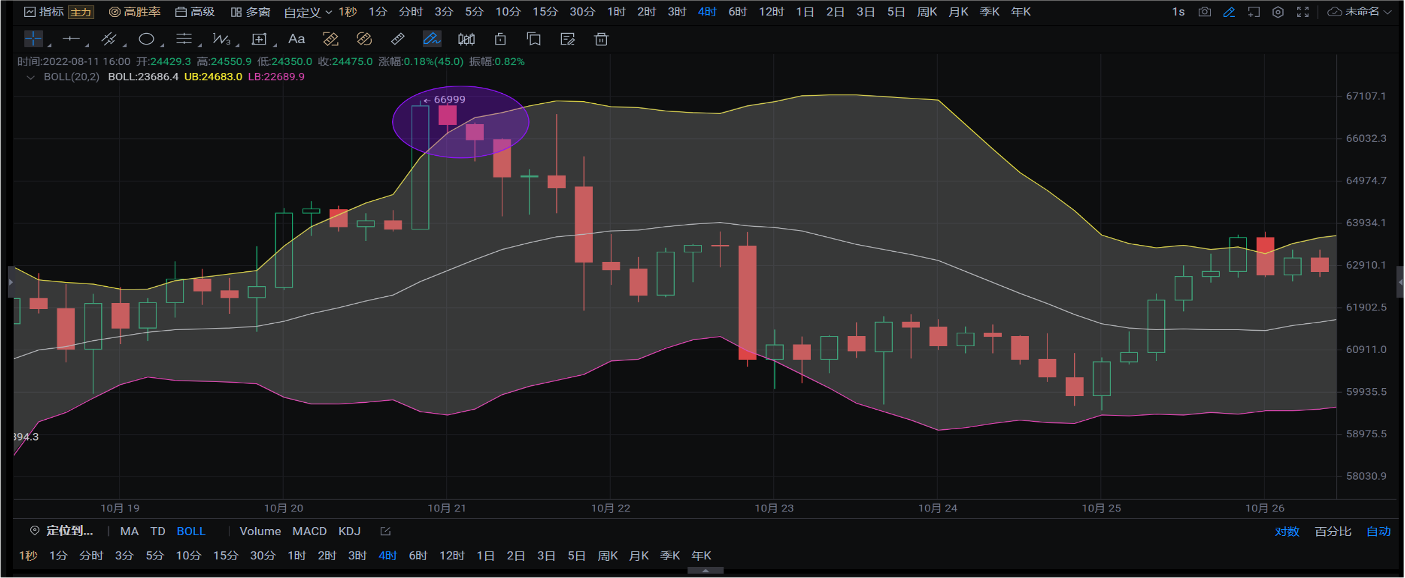
3. The Bollinger Bands indicator can signal overbought and oversold conditions. When the price breaks above the upper band, it shows the overbought condition. Conversely, when the price falls below the lower band, it displays the oversold condition.
4. When using the Bollinger Bands, it's essential to consider whether the price is within a normal range or an abnormal range. In abnormal ranges, you should not rely solely on the rule of "sell when it touches the upper band" and "buy when it touches the lower band
IV. Squeeze and Expansion of Bollinger Bands
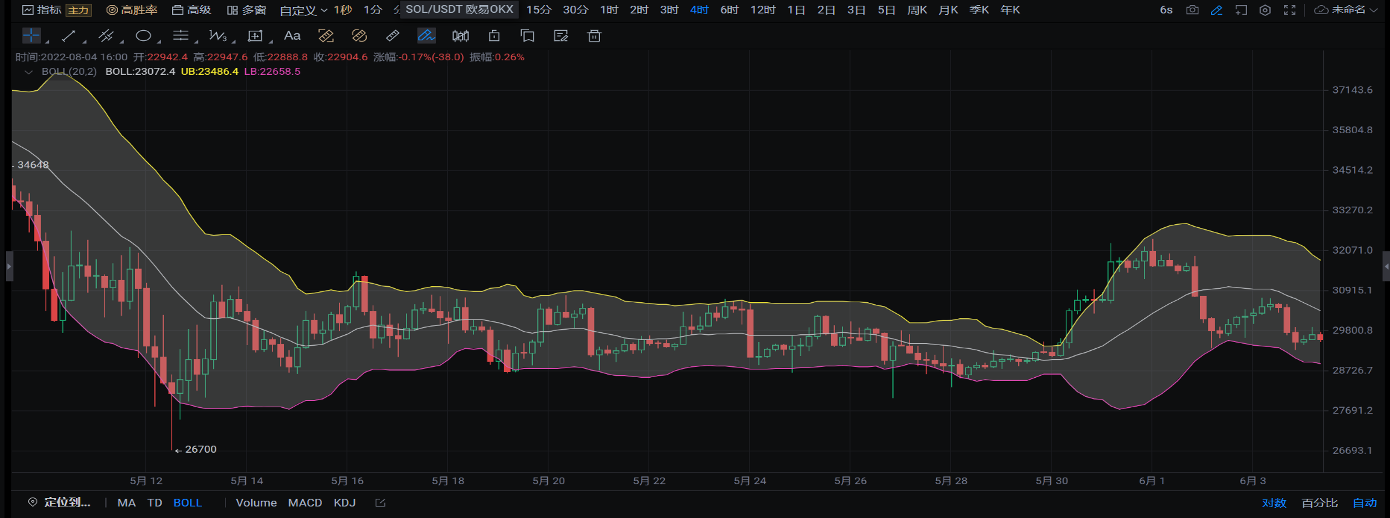
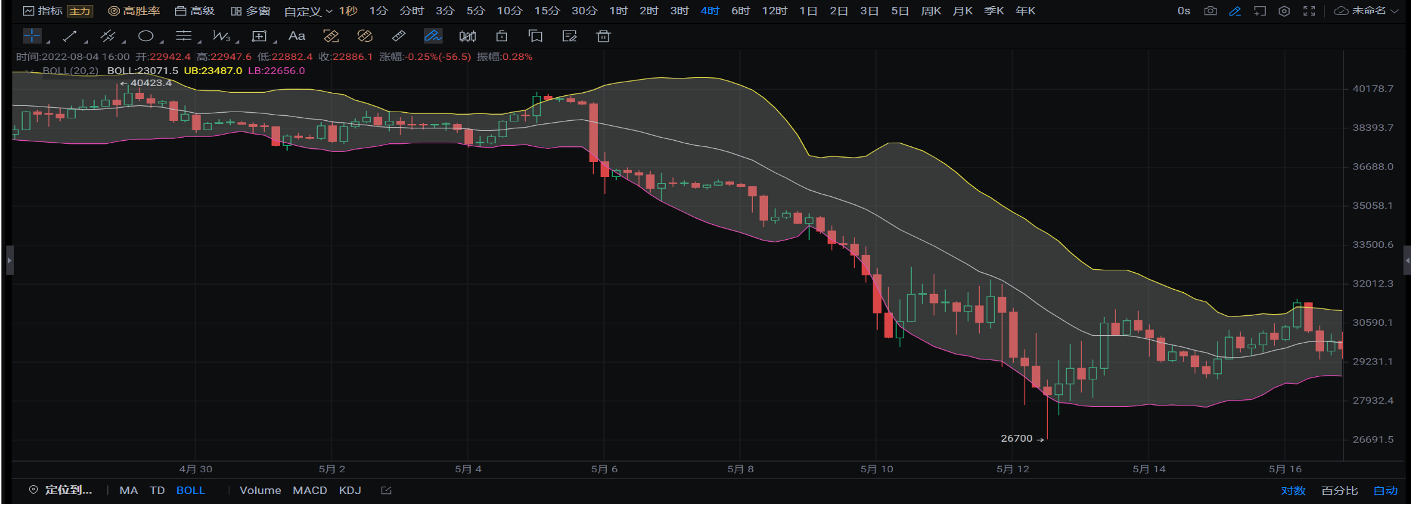
1. Expansion
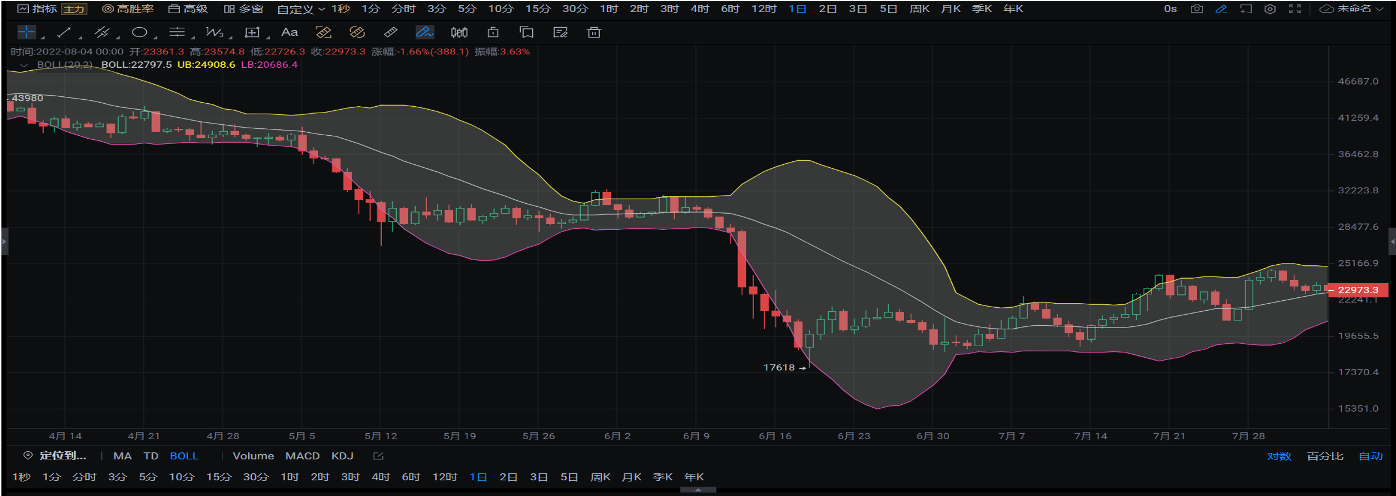
When Bollinger Bands widen, with the upper band moving up and the lower band moving down, they create an opening resembling a trumpet. This suggests increasing price volatility and the potential for a significant market move.
Pay attention to the direction of the middle band; if it rises, it's a buy signal, and if it falls, it's a sell signal.
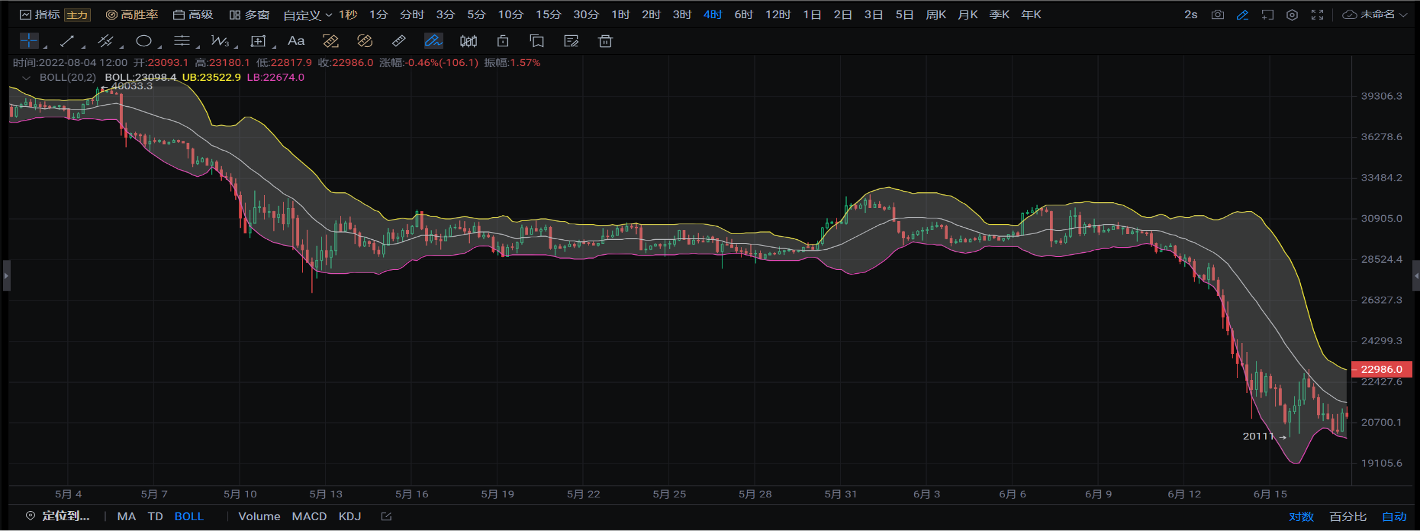
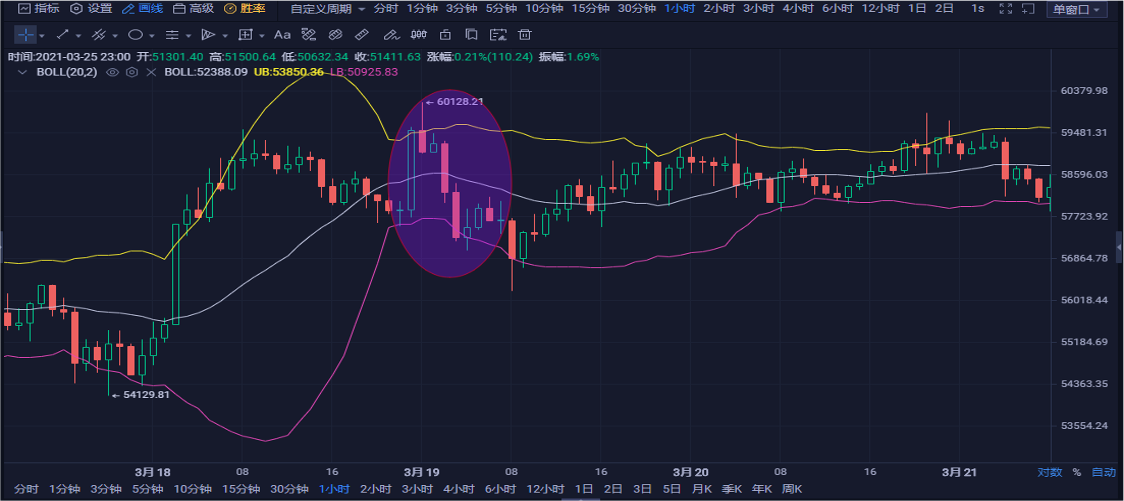
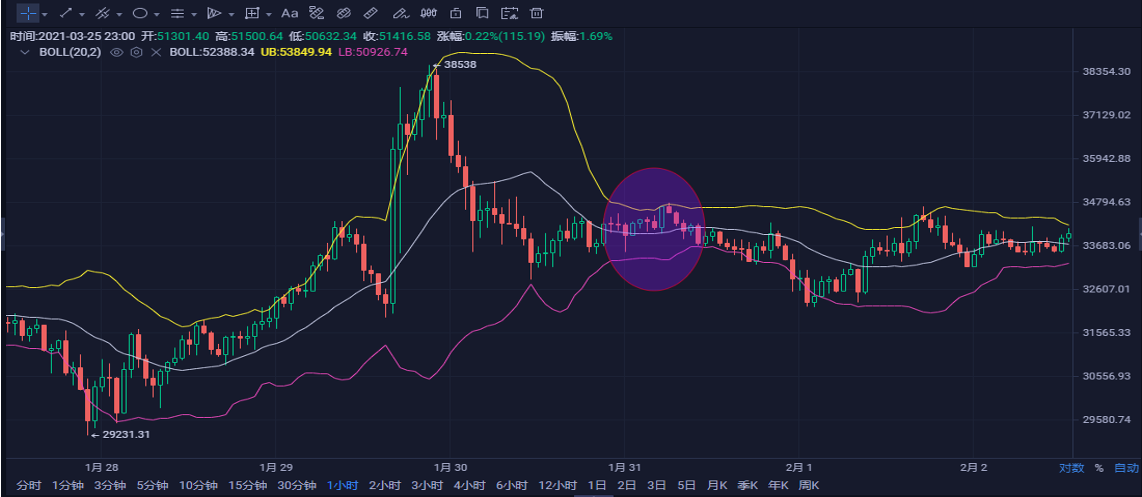
2. Squeeze
When Bollinger Bands contract, with the upper band moving down and the lower band moving up, they create a closing pattern. This indicates decreasing price volatility and an impending consolidation phase.
If this occurs after a significant price rise, consider taking profits; if it occurs after a price drop, avoid panicking and wait for a potential reversal before buying.
V. Rules for Using Bollinger Bands
1. Trading in Normal Price Ranges:
When Bollinger Bands move horizontally, indicating a normal price range, consider short-term selling when the price breaks above the upper limit and short-term buying when it breaks below the lower limit.
2. Trading in Abnormal Price Ranges:
When Bollinger Bands move upwards or downwards, signaling an abnormal range, look for consecutive upper band breakouts for potential upward trends and consecutive lower band breakouts for potential downward trends.
3. The "Three Buy Three Sell" Rule:
①Three Buy Points:
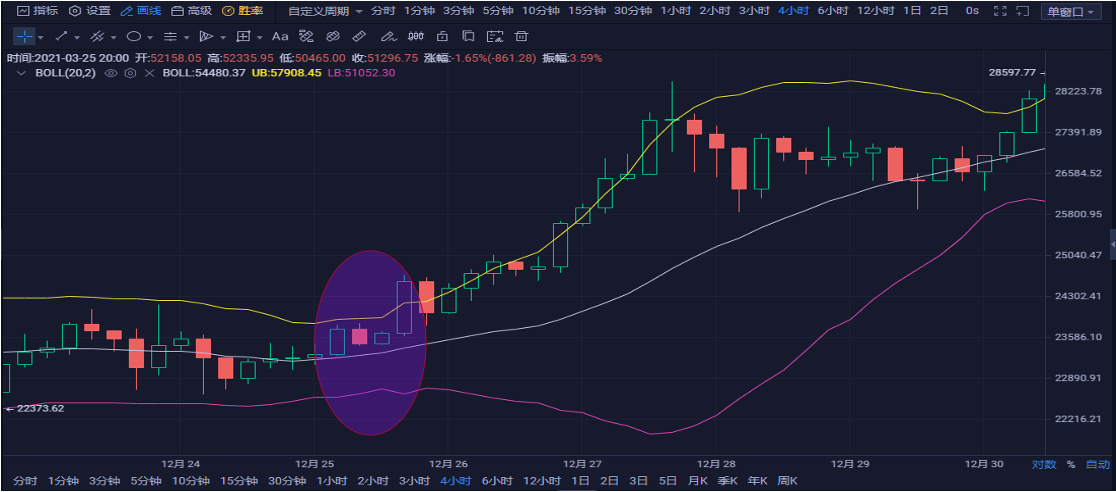
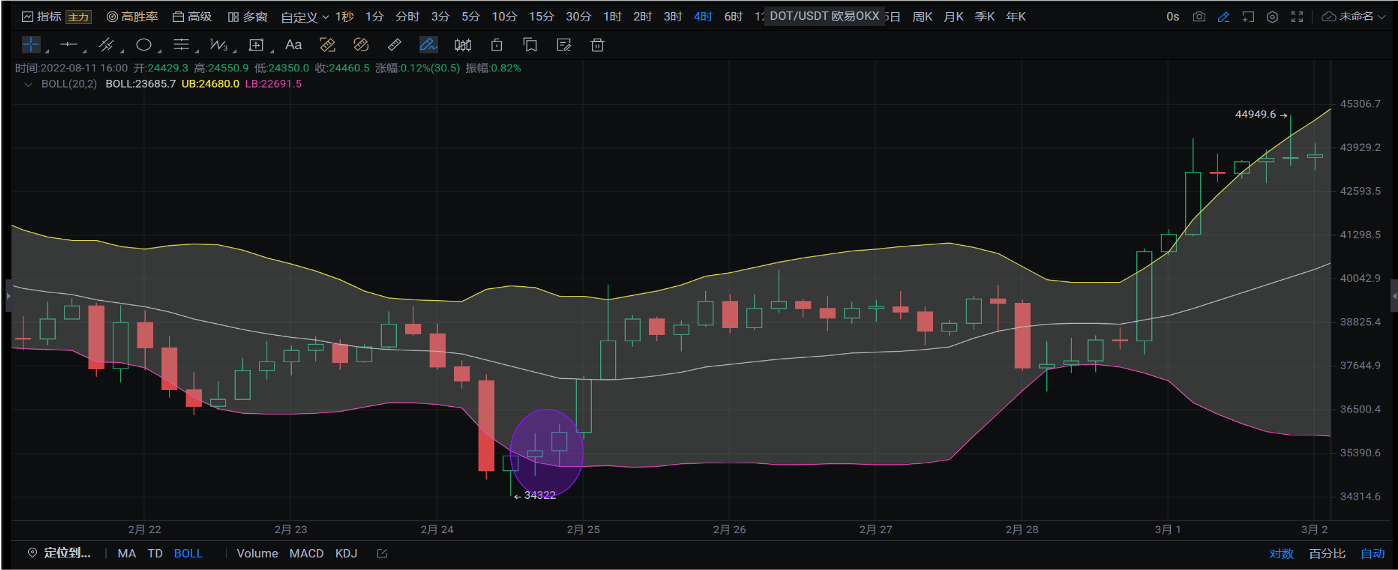
a. Buy when the lower band supports the price and starts to rise.
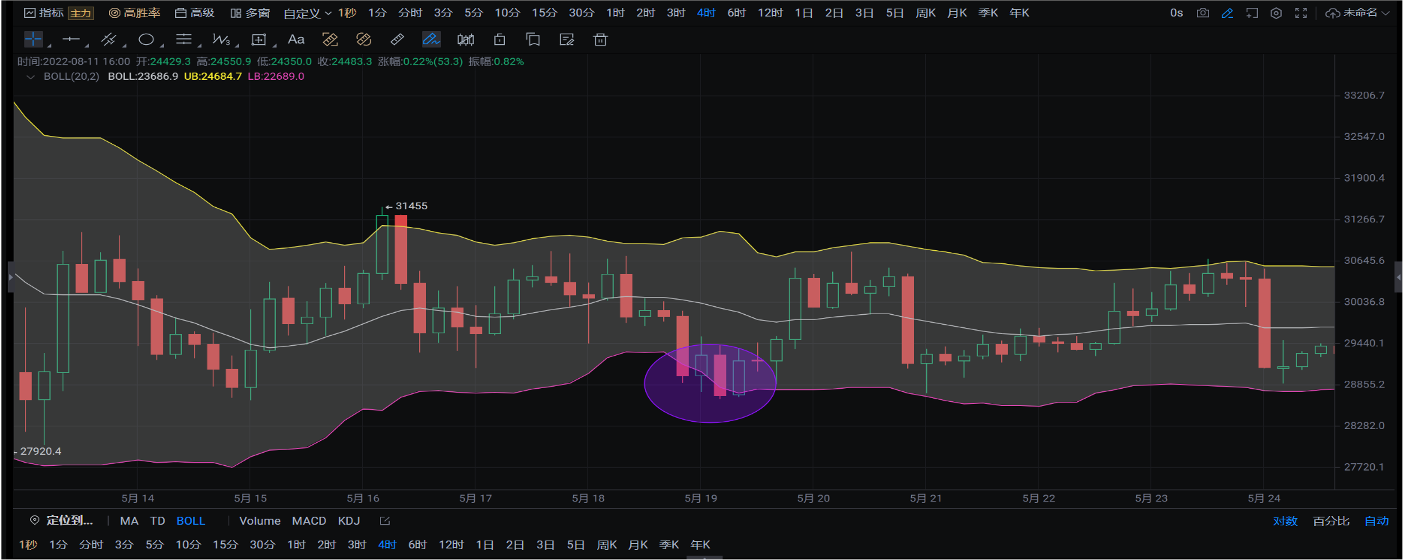
b. Buy when the price briefly dips below the lower band but returns inside the bands area.
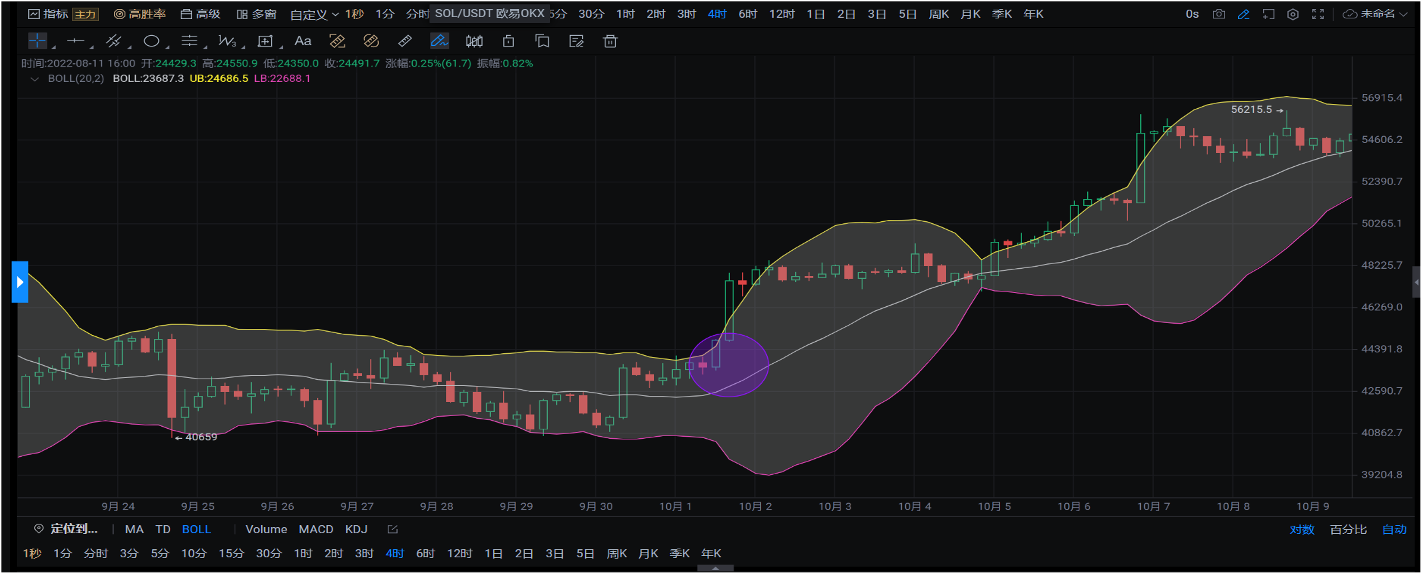
c. Buy when the Bollinger Bands open up (in the trumpet shape), and the middle band rises above the bands.
②Three Sell Points:
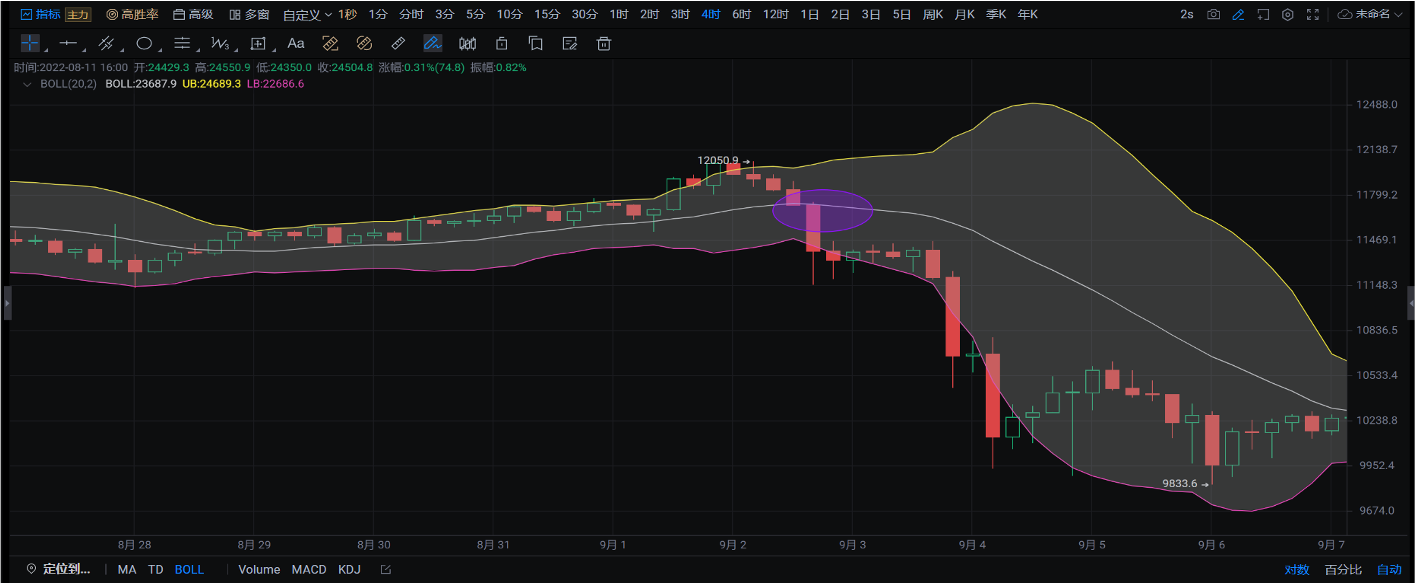
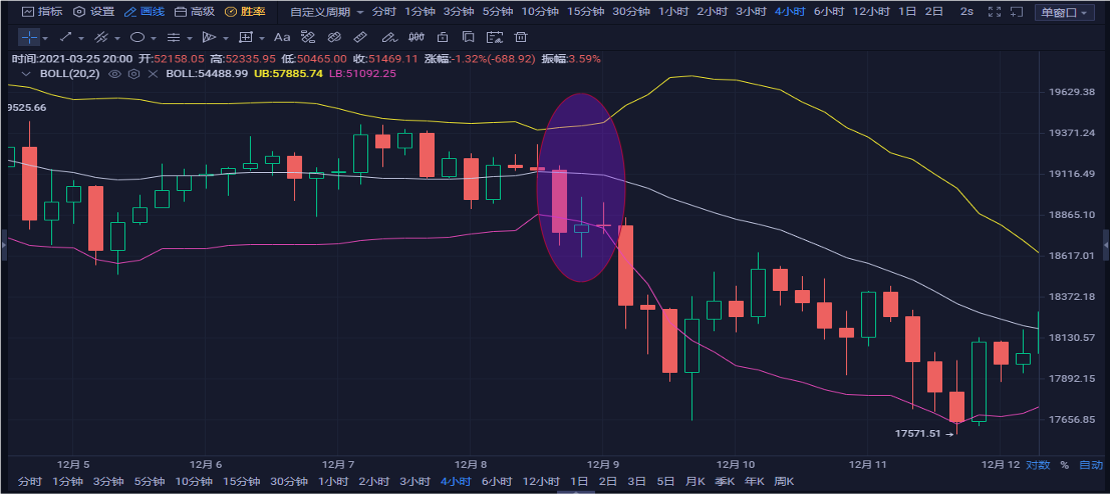
a. Sell when the upper band resists the price, causing it to fall.
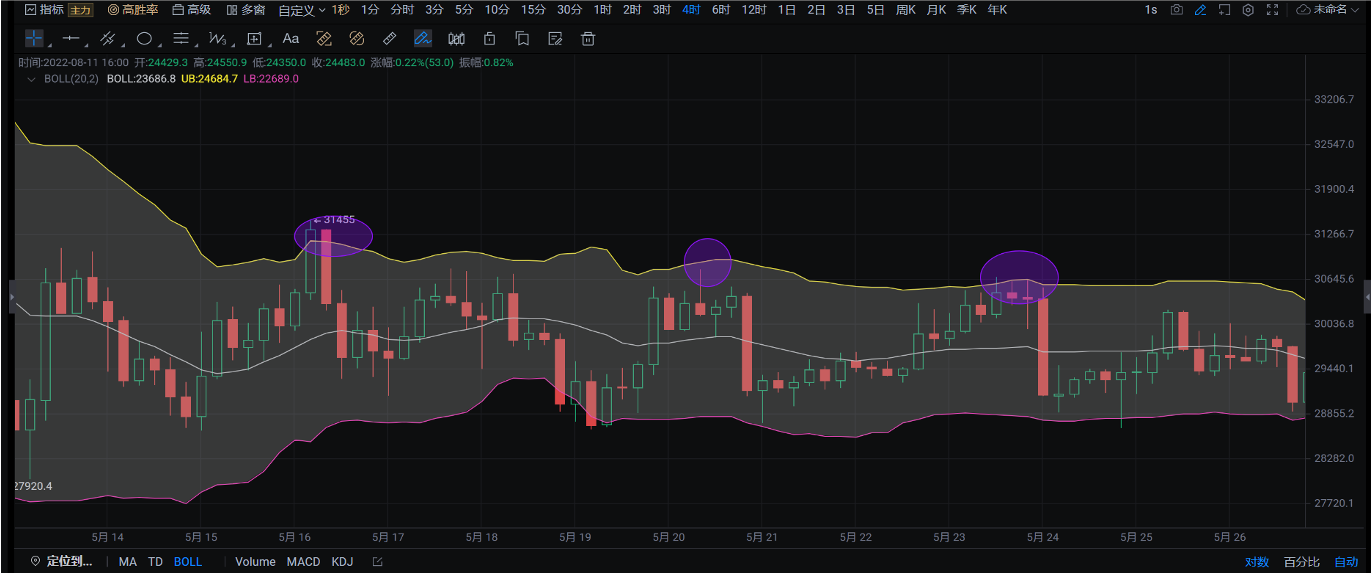
b. Sell when the price briefly breaks above the upper band but then drops below it.
c. Sell when the Bollinger Bands open up (in the trumpet shape), and the middle band falls.